Annotations
5. The Annotation section includes subsections containing ontology annotations assigned to the QTL. These are organized by ontology type and are linked to their respective annotation term and reference report pages. Also, see the evidence code guide to learn more about evidence codes.
 |
Disease Annotations: These annotations represent disease to QTL associations manually curated from the biomedical literature or imported through automated pipelines from OMIM (Online Mendelian Inheritance in Man) or GAD (Genetic Association Database). The terms come from the RGD Disease Ontology (RDO), which combines RGD-created disease terms with the Disease Ontology.
Phenotype Annotations: These annotations represent the association of QTL with particular phenotypes. The terms come from the Mammalian Phenotype Ontology (MP) developed at MGI and the Human Phenotype Ontology (HPO), currently being developed at the Jackson Laboratory for Genomic Medicine. The terms are supported by the same group of evidence codes as used for Disease vocabulary annotations.
Experimental Data Annotations: Listed are annotations using terms from five different ontologies, with the appropriate evidence codes. These terms were used to curate the QTL from the paper(s) originally describing it. If a disease term was used, it will be found in the “Disease Annotations” subsection. Each term links to a Term Annotation Report providing information and links about the reference used, the QTL and the ontology term, including a link to the term ontology report.
6. ‘Click to see Annotation Summary View’ shows annotations in summary mode.
The measurable phenotypic trait that has been mapped to the QTL. If multiple traits were reported in the article, only the trait with the highest statistical significance will be indicated.
|
References, Region and Additional Information
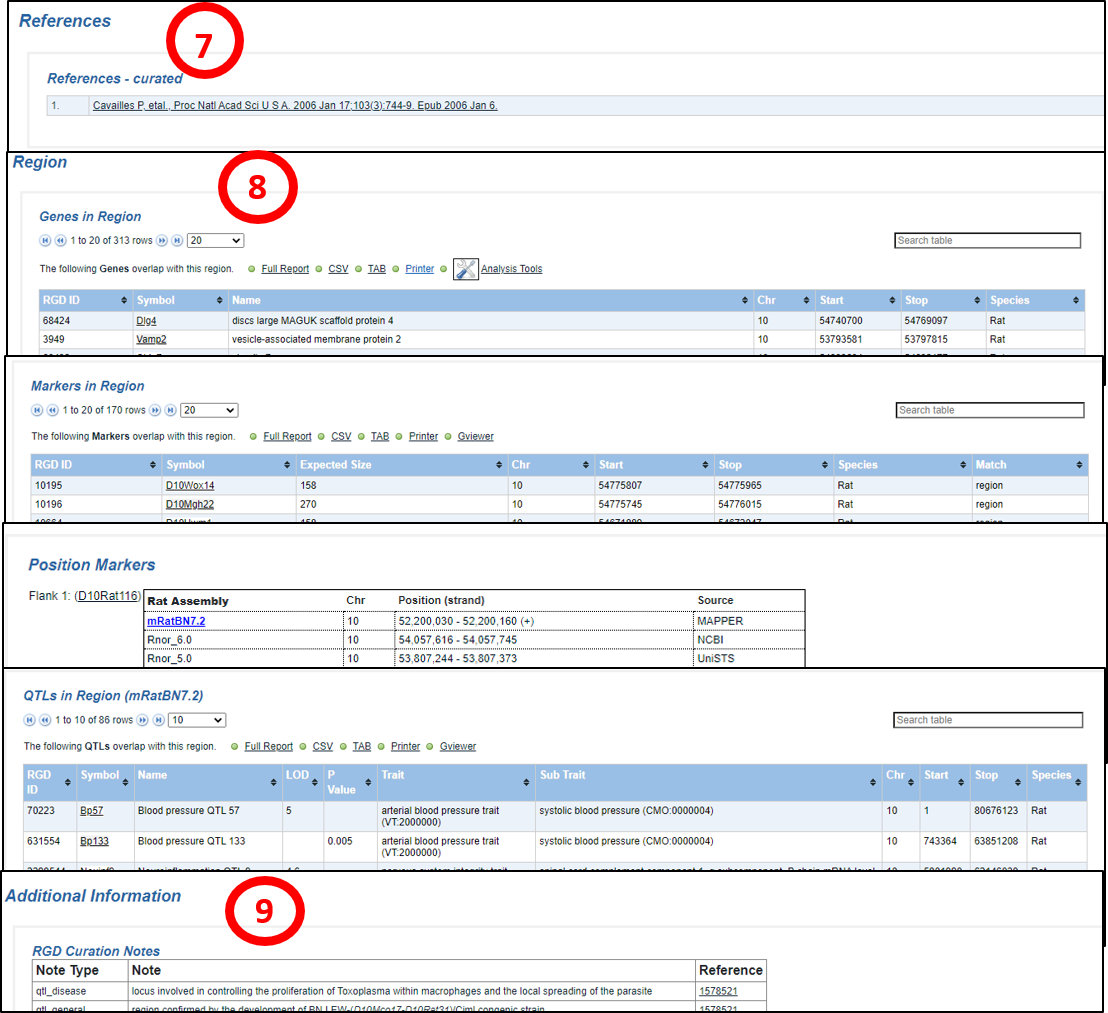 |
7. References – curated: All references connected to annotations on the QTL report page are listed here. Citations link to RGD Reference report pages which in turn link to PubMed in most cases. For more information about RGD Reference Reports, click here.
8. Region
Genes in Region: Lists genes in the genome assembly that overlap the region of the QTL, with descriptive information. The data is downloadable and exportable to analysis tools.
Markers in Region: Lists markers in the genome assembly that overlap the region of the QTL, with descriptive information. The data is downloadable and exportable and can be viewed in Gviewer (Gviewer help).
GViewer Position Markers: Flanking and/or peak markers are listed, with positional and source information, and links to marker report pages.
QTLs in Region: Lists other QTLs in the genome assembly that overlap the region of the QTL, with descriptive information. The data is downloadable and exportable.
9. Additional Information
RGD Curation Notes: Descriptive curator notes in several categories are listed with reference links.
|


